AAVE, the native token for the decentralized lending platform Aave, has caught the attention of whales as the token’s price has jumped over 30% in the past week.
At the time of publication, Aave (AAVE) was the 44th largest cryptocurrency, up from the 47th position it stood at on Aug. 20. The token’s market cap exceeded $2 billion and was up more than 3% over the past 24 hours.
According to price data from crypto.news, AAVE was trading at $137.64, down from its weekly high of $142.16 reached on Aug. 22. The token was up 30.9% over the past week and over 47.7% in the last 30 days. Despite the recent rally, the token is still down 79.2% from its all-time high of $661.69, reached in May 2021.
The surge has been primarily fueled by intense whale activity recorded over the past week. Most recently, on Aug. 22, Lookonchain data revealed that a whale scooped up roughly $10.4 million worth of AAVE for 4,000 staked Ethereum (ETH) in less than 24 hours.
The massive purchase was preceded by significant whale activity recorded on Aug. 20, with two whales buying $3.92 million worth of AAVE, with another large investor joining the trend the following day with a $6.65 million investment into the token.
A look into data from IntoTheBlock shows that whales holding over 1% of Aave’s circulating supply controlled 59.43% of AAVE’s total supply. The high concentration of whales suggests that the token’s price is being influenced by these large holders.
Further data shows a significant surge in both the inflows and outflows of AAVE among large holders, with inflows increasing by 90.37% and outflows by 95.79% over the last seven days.
However, the net flow of AAVE among large holders has jumped 364.73% during the same period, signaling that buying interest is currently prevailing, contributing to the upward momentum in AAVE’s price.
AAVE currently in overbought zone

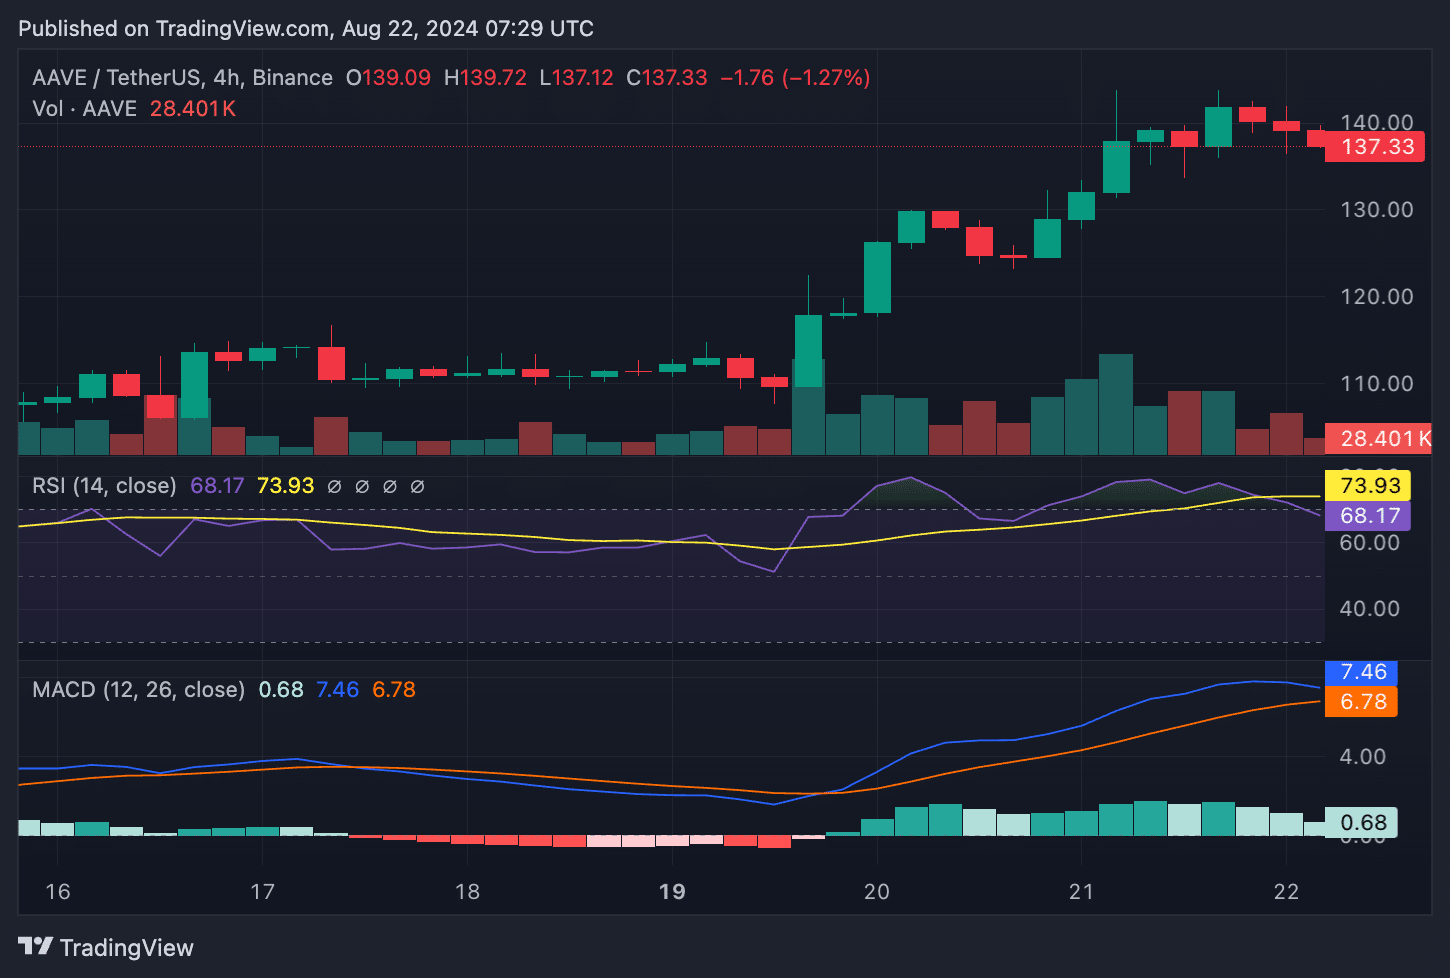
On the 4-hour candlestick chart of AAVE/USDT, its Relative Strength Index was at 73.93, suggesting that the token is currently overbought. The Moving Average Convergence Divergence, however, shows that the bullish momentum is still in play, as the MACD line remains above the signal line with positive histogram bars.
This likely means that while AAVE may be overbought, the upward momentum could continue for a bit longer, fueled by whale buying. However, overbought conditions often precede a price correction or consolidation phase, so traders might be looking to take some profits in the short term.

