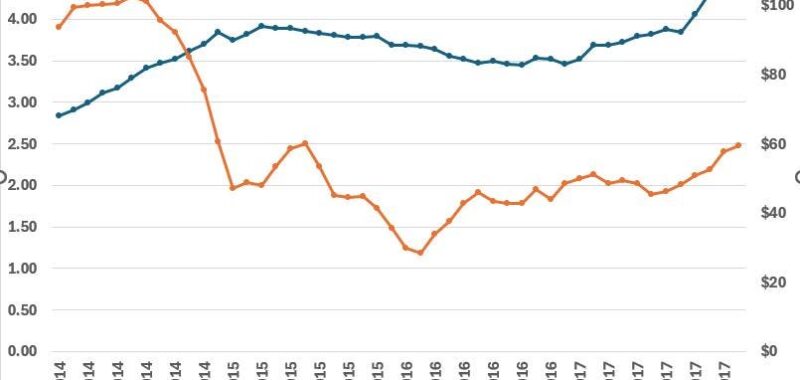
As oil prices loiter near 5- year lows and costs rise in the oil patch, expectations for U.S. shale oil production are becoming more pessimistic. Higher costs, with tariffs a major factor, have raised the perceived breakeven cost of production and, as prices slide, the possibility that shale production will cease growing and even decline is very real. Ater all, the price collapse in 2014/2015 saw a drop in production of 0.5 million barrels per day (mb/d); more important, the growth of 1 mb/d per year ended, as the Figure below shows. Now, falling prices and rising costs are the Scylla and Charybdis of the industry, requiring careful steering.
The Oil Price Crash and U.S. Shale
Data for the Bakken, Eagle Ford and Permian.
Without question, reduced upstream activity could mean lower production but how much and how quickly? This was certainly the case in 2014/15, when oil prices dropped by 70% and drilling collapsed. The number of rigs active in the Permian fell from 565 in November 2014 to 137 by April 216, for example, and many producers found themselves wallowing in red ink. Even when the price began to recover in 2016, it remained at half the pre-collapse level until 2018 and never completely recovered, staying below $70 most of the time since.
At the moment, a combination of factors has caused oil prices to drop nearly $20 a barrel and the market is the weakest it has been since the depths of the pandemic. Expected macroeconomic weakness is partly responsible, the IEA recently reducing their global oil demand forecast this year by 400 thousand barrels per day (tb/d). While this doesn’t sound like a major amount, over the course of the year it would translate into an inventory increase of 150 million barrels. All else being equal.
The decision by OPEC+ to accelerate the unwinding of voluntary production cuts in May and June to 410 tb/d from 180 tb/d is clearly the second most important factor, despite the group’s argument that global oil inventories are low (very true) and the market can thus absorb the additional supply (not so obvious). What matters is the perception that the group is not protecting the current price and especially that the Saudis are responding to consistent overproduction by some members. The implication is that the OPEC+ safety net is being withdrawn, at least for now, not unlike 2014.
Some hope that lower shale oil production will balance the market, but that might be too optimistic. The drilling decline will take time to affect production, despite the argument that high decline rates will cause production to drop quickly. As the figure below shows, in 2014, the price drop reduced drilling roughly three months later. (Figures show the combined rigs active in the Bakken, Eagle Ford, and Permian basins) Given that many small producers rely heavily on cash flow to fund operations, this is not surprising. Larger companies, like ExxonMobil and Chevron, are slower to adjust operations.
Rigs Active in 2014 Price Crash
Production was slower to respond. The price began dropping in August 2014, but production kept growing until January 2015, albeit at a slower pace, as the Figure above showed. But just as important, the trend changed: whereas production grew by 580 tb/d from January 2014 to July, from July to January 2015, production was flat. A repetition of that performance this year would go far to offset demand weakness due to macroeconomic conditions, removing perhaps 75 million barrels per day from the market.
Another facet of this year’s market balance cannot be ignored: production from non-OPEC+ countries other than the U.S. The IEA is anticipating, even before the current economic turmoil, that U.S. production would grow slowly this year; other non-OPEC+ countries would account for the bulk of the growth, especially Brazil, Guyana and Canada. In the case of the former two, production increases are from large-scale, long-term developments which will not respond to changes in prices.
That U.S. contributed to one-third of non-OPEC production growth in the past two years, but now is due to add less than one-fifth this year and next, means that the amount of price-response production growth is declining, making it more difficult for OPEC+ to use price to balance the market.
And while at this point it does not appear that we will experience a price collapse like 1998, when the price dropped to $20 per barrel adjusted for inflation, a more moderate drop now to $50 or so would not have a major impact on current production. Even if the breakeven price for oil shale production is $50, that is the long-run marginal cost which includes capital costs. The short-run marginal costs is typically a fraction of that, given that oil is a very capital intensive industry. Thus, to shut in most existing production would require extremely low prices.
More likely, of course, is that the OPEC+ members who have been producing over their quotas, primarily Iraq and the U.A.E. and more recently Kazakhstan, will have their minds concentrated not, as Samuel Johnson would say, by the gallows but by an oil price below $50. Given their repeated promises, largely unkept, it is not clear what it would take for them to convince the Saudis that they are serious this time. Still, as has been true for decades, cooperation and compliance to quotas can yield strong short-term gains which is why the group has been so successful.
Longer term trends depend on what price the group ultimately defends. Is this situation like 1985 where plummeting demand necessitated that prices remain lower for a decade and a half? Or like 1998, when a return to quota compliance meant that prices could be allowed to rise? That depends in large part on the U.S. shale oil industry: after the 2014/2015 price collapse, production growth resumed even as prices remained below $60. (Figure below.) Such seems less likely now, but OPEC+ desperately needs shale production to at least be flat and preferably decline. Shale producers, and particularly their petroleum engineers, might not cooperate.
U.S. Shale Oil Production (mb/d)